Using SQL Expressions in Grafana with Elasticsearch Queries
Grafana 12.2.0 introduced SQL expressions, a feature that allows you to transform or calculate data after it has been retrieved from the data source, but before it is sent to the frontend for visualization. These expressions are evaluated server-side, not in the browser or at the data source.
I wished for this feature for a while, especially when working with Elasticsearch queries, as it opens up new possibilities for data manipulation and analysis that aren’t possible with standard Elasticsearch (aggregation) queries alone.
Because it’s in public preview, the feature must be enabled in your Grafana configuration:
[feature_toggles]
enable = sqlExpressions
Restart Grafana after making this change.
Basic Usage
It wasn’t immediately clear to me how to use column names from Elasticsearch in these SQL expressions, so here’s a quick guide.
First, set up your regular Elasticsearch query as Query A. Then add a second query by clicking the + Expression button and selecting SQL. You can now use basic SQL syntax to query the data from Query A:
SELECT
  *
FROM
  A
This simply passes through all data from Query A so you can see the available columns in a table visualization. It also works with any other visualization type, such as line graphs, but tables are easiest for exploring the data.
Discovering Column Names from Elasticsearch
Things get more interesting when you want to use specific columns from the Elasticsearch query. For example, if you have an aggregation query with one average and a group by terms:

You must then use “Average” as a column name in your SQL expression:
SELECT
  `service.keyword`,
  `Average` AS `Avg. Loading Delay`
FROM
  A
ORDER BY `service.keyword`
But what if you have multiple averages? Now you need to include the actual Elasticsearch field names because Average alone is ambiguous:

SELECT
  `service.keyword`,
  `Average statistic_values.initial_loading_delay` AS `Avg. Loading Delay`,
  `Average statistic_values.average_video_bitrate` AS `Avg. Bitrate`
FROM
  A
ORDER BY `service.keyword`
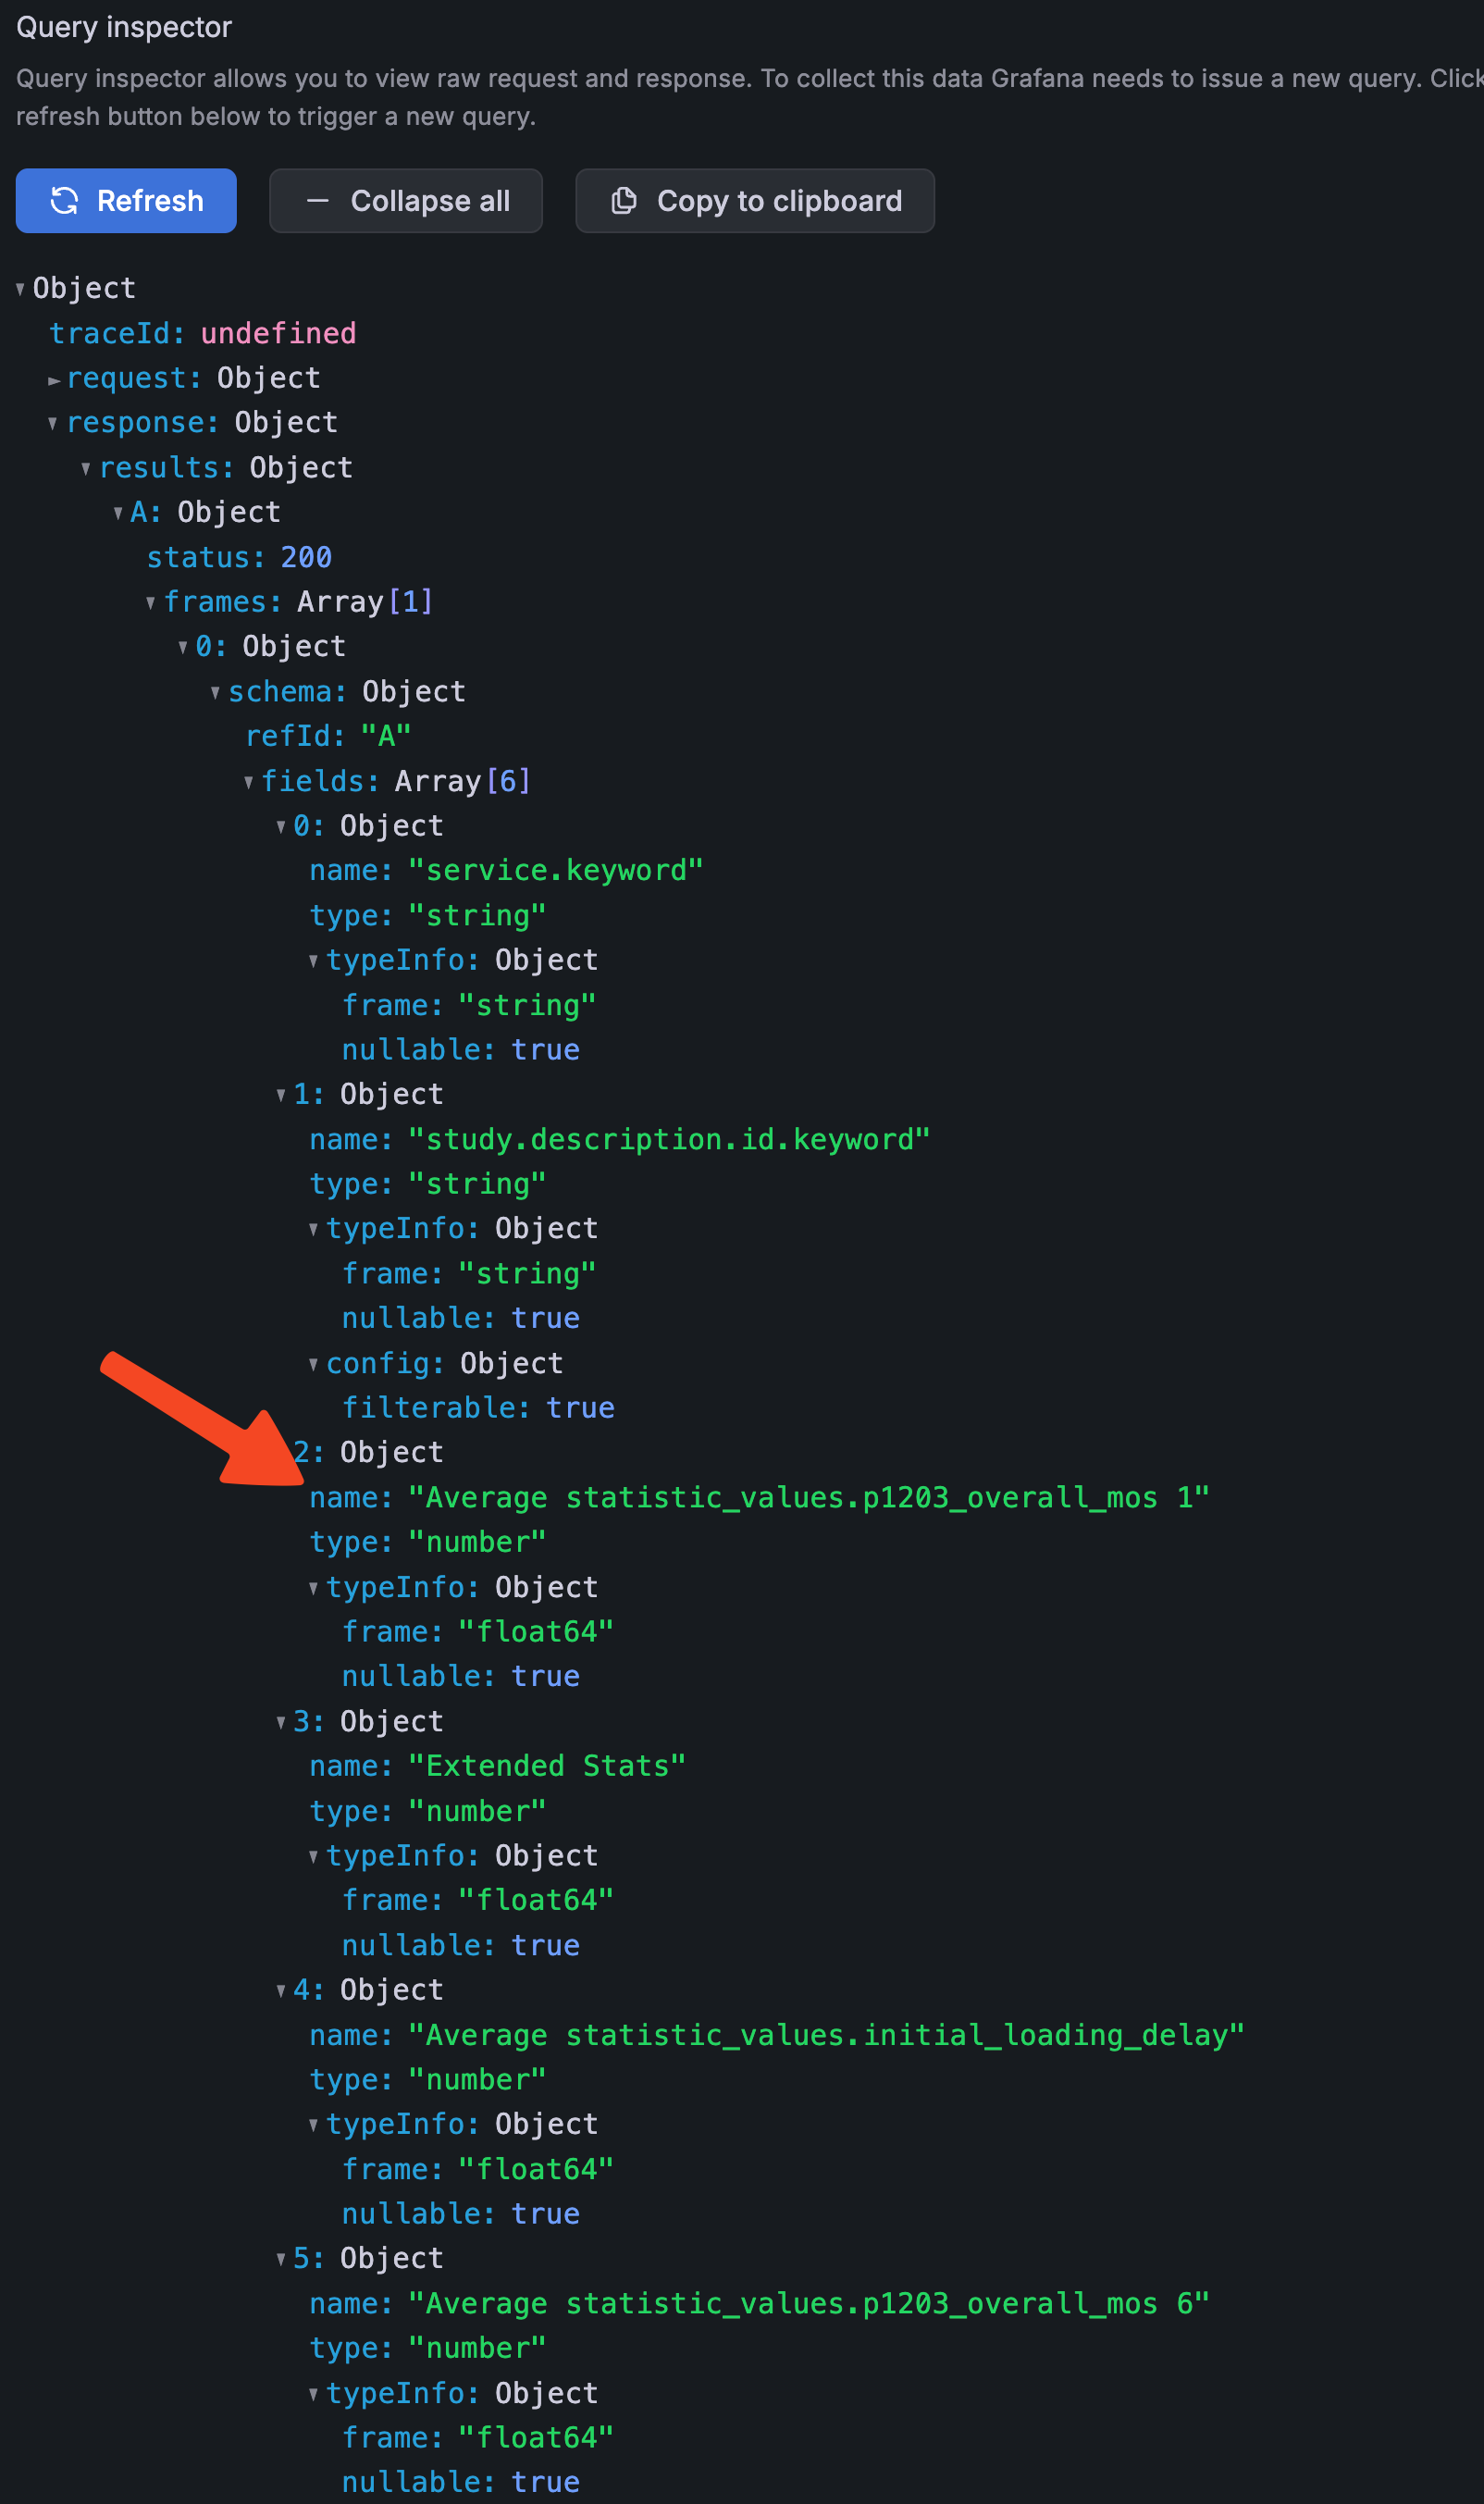
For complex Elasticsearch queries where you’re unsure about the exact column names, you should use the Query Inspector:
- Make sure your SQL query is valid (use a wildcard query like
SELECT * FROM Aif unsure) - Click the “Query Inspector” button and select “Expand all”
- Check the entire
responsecontent and look for thenameattributes
Here is an example response from a more complex Elasticsearch query that shows the relevant section:

These name values are the column names you can use in your SQL expressions.
Conclusion
Using SQL expressions in Grafana with Elasticsearch queries allows for enhanced data transformations and calculations that were previously difficult… or impossible. Just leverage the Query Inspector to discover all column names.
PS: It would be nice if Grafana supported auto-complete for column names, or a more visual SQL expression builder in the future! PPS: Even better would be ES|QL support, but this is an open issue on their end.